Instant Criminal Background Checks

Criminal Background Checks
  • ACCOUNT SIGN IN
  • ORDER LOOKUP

  • CREATE AN ACCOUNT
  • ORDER NOW
  •    
Criminal Background Checks for Employment Screening
BBB Accredited Business  SSL Security 
  • Home
    • About Instant Criminal Checks
    • Testimonials, Reviews and Endorsements
    • Contact Instant Criminal Checks
  • Order Now
    • Use PayPal
  • Services
    • State Criminal Background Checks
    • 3 State Criminal Background Check
    • National Criminal Background Check
    • County Criminal Background Checks
    • Federal Background Check
    • SSN Verification and Address History Trace
    • National Sex Offender Search
  • Services By State
    • States: A-L
      • Alabama Criminal Background Check
      • Alaska Criminal Background Check
      • Arizona Criminal Background Check
      • Arkansas Criminal Background Check
      • California Criminal Background Check
      • Colorado Criminal Background Check
      • Connecticut Criminal Background Check
      • Delaware Criminal Background Check
      • Florida Criminal Background Check
      • Georgia Criminal Background Check
      • Guam Criminal Background Check
      • Hawaii Criminal Background Check
      • Idaho Criminal Background Check
      • Illinois Criminal Background Check
      • Indiana Criminal Background Check
      • Iowa Criminal Background Check
      • Kansas Criminal Background Check
      • Kentucky Criminal Background Check
      • Louisiana Criminal Background Check
    • States: M-O
      • Maine Criminal Background Check
      • Maryland Criminal Background Check
      • Massachusetts Criminal Background Check
      • Michigan Criminal Background Check
      • Minnesota Criminal Background Check
      • Mississippi Criminal Background Check
      • Missouri Criminal Background Check
      • Montana Criminal Background Check
      • Nebraska Criminal Background Check
      • Nevada Criminal Background Check
      • New Hampshire Criminal Background Check
      • New Jersey Criminal Background Check
      • New Mexico Criminal Background Check
      • New York Criminal Background Check
      • North Carolina Criminal Background Check
      • North Dakota Criminal Background Check
      • Ohio Criminal Background Check
      • Oklahoma Criminal Background Check
      • Oregon Criminal Background Check
    • States: P-W
      • Pennsylvania Criminal Background Check
      • Puerto Rico Criminal Background Check
      • Rhode Island Criminal Background Check
      • South Carolina Criminal Background Check
      • South Dakota Criminal Background Check
      • Tennessee Criminal Background Check
      • Texas Criminal Background Check
      • Utah Criminal Background Check
      • Vermont Criminal Background Check
      • Virgin Islands Criminal Background Check
      • Virginia Criminal Background Check
      • Washington Criminal Background Check
      • Washington DC Criminal Background Check
      • West Virginia Criminal Background Check
      • Wisconsin Criminal Background Check
      • Wyoming Criminal Background Check
  • Resources
    • FCRA Compliance and Forms
    • FAQ and Questions
  • Employers
    • Health Care Background Check Solutions
    • Education Background Check Services
    • Staffing Background Check Services
  • Landlords
    • Tenant Credit Score and Credit Report
  • Samples
  • Press
  • Blog

Workplace Violence: More Common Than People Think?

July 3, 2014 by criminalchecks Leave a Comment

Workplace violence is a devastating but widespread problem. Criminal report checks can help prevent incidents.

When people go to work, they and their families should not have to be concerned about their safety and whether they will make it home at the end of the day. Unfortunately, violence in the workplace is a relatively commonplace occurrence that many Americans will face in their lifetimes. A variety of circumstances can trigger workplace violence, but instituting criminal report checks during the hiring process can help reduce the risk of violent crimes.

Workplace Violence: Far from Uncommon

A nationwide survey among private businesses, conducted by the Bureau of Labor Statistics (BLS), found that almost one out of every twenty non-governmental businesses experienced workplace violence at least once in the previous year. In the government sector, state government agencies had the highest rates of violence, with 32 percent reporting violence within the past year. These events can not only harm employees and any clients who are on site, but also harm employee morale, reduce productivity, and increase absenteeism and health insurance premiums.

Most Violent IndustriesWorkplace Violence and Criminal Report Checks

Some of the industries with relatively high rates are the healthcare, service, utilities, and delivery industries. These are some of the characteristics that are risk factors for workplace violence.

  • Direct contact with customers.
  • Exchanging money.
  • Location in high crime areas.
  • Working in community settings.
  • Working in a mobile setting.

Criminal Report Checks as a Strategy for Preventing Workplace Violence

Strategies for preventing workplace violence can take multiple forms.

  • Electronic surveillance
  • Security staff
  • Physical security

Fewer than 10 percent of those businesses that had workplace violence in the past year reported changing their workplace violence prevention policies in response, but adding criminal report checks to the hiring process is a strategy that can pay off. The human resources department of a larger business, or the person responsible for hiring in smaller companies, can hire a respected company to conduct criminal report checks. This process can reduce the chances of having potentially violent people within the workplace every day.

Workplace violence is unfortunately more common than people tend to believe, but it is preventable in many cases. A national criminal background check program can help keep workers and clients safer.

Source: http://www.bls.gov/iif/osh_wpvs.htm

Disclaimer: The information on InstantCriminalChecks.com is governed by our Terms of Use and is never intended as legal advice.

Share this:

  • Tweet
  • Share on Tumblr
  • Print
  • Email

Filed Under: blog

Montana Employment Background Check Information and Montana (MT) Criminal Data

June 30, 2014 by criminalchecks Leave a Comment

Montana Employment Background CheckDid you know that Montana became a state of the United States in 1889, 23 years after a failed bid for statehood in 1866? This week we are discussing Montana employment background check information, Montana crime data, and other general state information in our weekly blog series, “Criminal Data and Employment Background Check Information for Your Favorite State”!

About Montana*

Montana Population and Age Distribution. Montana’s estimated population was 1 million. The median age was 40.2 years. 22% of the population was under the age of 18, and 16% was 65 years and over.

Median Household Income. The median income of households was $45,076. The total number of households was 408,938 with an average of 2.39 people.

Montana Employment and Unemployment Rate. 59.6% of the Montana population over the age of 15 were employed which ranks 19th in the nation. The Montana unemployment rate is 7.2% which was ranked 38th in the country.

Types of Employers. The types of employers in Montana were as follows: 43,883 (9.1%) were self-employed, 90,797 (18.8%) were employed by the federal, state, or local government and 345,860 (71.6%) were employed by the private sector.

Top Five Industries. The top five industries by percent in Montana were: Educational Services and Health Care (22.8%), Accommodations/Food Service/Entertainment (11.9%), Retail (11.7%), Professional/Administrative/Scientific (8.8%),and Natural Resources, Construction, and Maintenance (8.1%).

Occupations. Occupations for the population employed (over the age of 15) in Montana’s private sector were: Business, Science, and Arts (36.5%), Sales and Office (22.4%), Service (19.2%), Natural Resources, Construction, and Maintenance (12.3%), and Production, Transportation, and Material Moving (9.6%).

Montana Health Insurance Coverage. 82% of the civilian non-institutionalized population had health insurance coverage (18% had no coverage). Of those with coverage, 64% had private coverage and 32% had public coverage.

Disability. 13% of the civilian non-institutionalized population of Montana reported a disability. The Montana disability claim rate was ranked 21st in the country.

For a list of Montana counties, cities, towns, and county court houses, click here.

Montana Crime Data*

Total Violent Crimes. Montana had 2,736 total violent crimes (which ranked 45th in the nation) and with a violent crime rate of 0.27% (which ranked it 36th among all the states including DC & PR). Of the total number of violent crimes, 27 were murders, 379 were forcible rapes, 191 were robberies, and 2,139 were aggravated assaults.

Property Crime. Montana had 25,970 total property crimes. Of the total number of property crimes, 3,894 were burglaries, 20,387 were larceny/thefts, and 1,689 were motor vehicle thefts.

Law Enforcement. Montana had the 36th most law enforcement employees per population. Montana ranked 37th in the nation for the most police officers per population.

For more Montana crime information, please see the Montana Department of Justice Division of Criminal Investigation Criminal History Online Public Record Search (CHOPRS) website.

Montana Employment Background Check Products

InstantCriminalChecks.com offers two Montana employment background check products: a Montana county criminal background check and a Montana state criminal background check.

The Montana state criminal background check includes a Montana corrections background check, a sex offender record search of Montana as well as the entire country, and a search of the Most Wanted List. The corrections background check pulls current and historical felony and gross misdemeanor conviction records. The Montana state criminal background check is “instant” and results are received within seconds of placing an order. The price of this product is only $24.95. For the full description, please visit our Montana criminal background check webpage.

The Montana county criminal background check will return felony and misdemeanor convictions and deferred judgments from the district courts, limited jurisdiction court, and justice courts over the past seven years. The results are provided within one to three business days. The cost of this product is $24.95.

Other Montana employment background check products include an instant national criminal background check that searches 46 states and D.C. (this product is $59.95) and a 3-state criminal background check (this product is $39.90).

*Sources: U.S. Census Bureau and FBI. “About Montana” data is from 2011. “Montana Crime Data” data is from 2012.

Share this:

  • Tweet
  • Share on Tumblr
  • Print
  • Email

Filed Under: states

Missouri Employment Background Check Information and Missouri (MO) Criminal Data

June 25, 2014 by criminalchecks Leave a Comment

Missouri Employment Background CheckDid you know that the Missouri Territory was acquired as part of the Louisiana Purchase from France in 1803? This week we are discussing Missouri employment background check information, Missouri crime data, and other general state information in our weekly blog series, “Criminal Data and Employment Background Check Information for Your Favorite State”!

About Missouri*

Missouri Population and Age Distribution. Missouri’s estimated population was 6 million. The median age was 38.2 years. 23% of the population was under the age of 18, and 15% was 65 years and over.

Median Household Income. The median income of households was $45,321. The total number of households was 2,359,135 with an average of 2.48 people.

Missouri Employment and Unemployment Rate. 57.9% of the Missouri population over the age of 15 were employed which ranks 29th in the nation. The Missouri unemployment rate is 8.6% which was ranked 27th in the country.

Types of Employers. The types of employers in Missouri were as follows: 164,113 (5.9%) were self-employed, 355,790 (12.9%) were employed by the federal, state, or local government and 2,239,703 (81%) were employed by the private sector.

Top Five Industries. The top five industries by percent in Missouri were: Educational Services and Health Care (24.3%), Retail (12.1%), Manufacturing (11.6%), Professional/Administrative/Scientific (9.3%), and Accommodations/Food Service/Entertainment (9.3%).

Occupations. Occupations for the population employed (over the age of 15) in Missouri’s private sector were: Business, Science, and Arts (34.5%), Sales and Office (25%), Service (18.2%), Production, Transportation, and Material Moving (13.6%), and Natural Resources, Construction, and Maintenance (8.7%).

Missouri Health Insurance Coverage. 86% of the civilian non-institutionalized population had health insurance coverage (14% had no coverage). Of those with coverage, 68% had private coverage and 31% had public coverage.

Disability. 14% of the civilian non-institutionalized population of Missouri reported a disability. The Missouri disability claim rate was ranked 11th in the country.

For a list of Missouri counties, cities, towns, and county court houses, click here.

Missouri Crime Data*

Total Violent Crimes. Missouri had 27,155 total violent crimes (which ranked 14th in the nation) and with a violent crime rate of 0.45% (which ranked it 14th among all the states including DC & PR). Of the total number of violent crimes, 389 were murders, 1,511 were forcible rapes, 5,782 were robberies, and 19,473 were aggravated assaults.

Property Crime. Missouri had 199,590 total property crimes. Of the total number of property crimes, 42,466 were burglaries, 140,816 were larceny/thefts, and 16,308 were motor vehicle thefts.

Law Enforcement. Missouri had the 18th most law enforcement employees per population. Missouri ranked 16th in the nation for the most police officers per population.

For more Missouri crime information, please see the Missouri Criminal Justice Information Services (CJIS) Division website.

Missouri Employment Background Check Products

InstantCriminalChecks.com offers two Missouri employment background check products: a Missouri county criminal background check and a Missouri state criminal background check.

The Missouri state criminal background check includes a Missouri corrections background check, a sex offender record search of Missouri as well as the entire country, and a search of the Most Wanted List. The corrections background check pulls from records of inmates, probationers and parolees. The Missouri state criminal background check is “instant” and results are received within seconds of placing an order. The price of this product is only $24.95. For the full description, please visit our Missouri criminal background check webpage.

The Missouri county criminal background check will return felony and misdemeanor convictions and deferred judgments from the circuit courts over the past seven years. The results are provided within one to three business days. The cost of this product is $24.95.

Other Missouri employment background check products include an instant national criminal background check that searches 46 states and D.C. (this product is $59.95) and a 3-state criminal background check (this product is $39.90).

*Sources: U.S. Census Bureau and FBI. “About Missouri” data is from 2011. “Missouri Crime Data” data is from 2012.

Share this:

  • Tweet
  • Share on Tumblr
  • Print
  • Email

Filed Under: states

Mississippi Employment Background Check Information and MS Criminal Data

June 20, 2014 by criminalchecks Leave a Comment

Mississippi Employment Background CheckThis week we are discussing Mississippi employment background check information, Mississippi crime data, and other general state information in our weekly blog series, “Criminal Data and Employment Background Check Information for Your Favorite State”! Did you know that Mississippi has the lowest median household income which makes it the poorest state in the United States?

About Mississippi*

Mississippi Population and Age Distribution. Mississippi’s estimated population was 3 million. The median age was 36.2 years. 25% of the population was under the age of 18, and 14% was 65 years and over.

Median Household Income. The median income of households was $37,095. The total number of households was 1,090,521 with an average of 2.65 people.

Mississippi Employment and Unemployment Rate. 51.4% of the Mississippi population over the age of 15 were employed which ranks 50th in the nation. The Mississippi unemployment rate is 11.3% which was ranked 5th in the country.

Types of Employers. The types of employers in Mississippi were as follows: 66,932 (5.6%) were self-employed, 230,468 (19.3%) were employed by the federal, state, or local government and 894,499 (75%) were employed by the private sector.

Top Five Industries. The top five industries by percent in Mississippi were: Educational Services and Health Care (24.4%), Manufacturing (13.3%), Retail (11.6%), Accommodations/Food Service/Entertainment (9.7%), and Construction (6.5%).

Occupations. Occupations for the population employed (over the age of 15) in Mississippi’s private sector were: Business, Science, and Arts (30.8%), Sales and Office (24%), Service (18.1%), Production, Transportation, and Material Moving (15.9%), and Natural Resources, Construction, and Maintenance (11.3%).

Mississippi Health Insurance Coverage. 83% of the civilian non-institutionalized population had health insurance coverage (17% had no coverage). Of those with coverage, 56% had private coverage and 38% had public coverage.

Disability. 17% of the civilian non-institutionalized population of Mississippi reported a disability. The Mississippi disability claim rate was ranked 3rd in the country.

For a list of Mississippi counties, cities, towns, and county court houses, click here.

Mississippi Crime Data*

Total Violent Crimes. Mississippi had 7,786 total violent crimes (which ranked 37th in the nation) and with a violent crime rate of 0.26% (which ranked it 38th among all the states including DC & PR). Of the total number of violent crimes, 220 were murders, 822 were forcible rapes, 2,284 were robberies, and 4,460 were aggravated assaults.

Property Crime. Mississippi had 83,906 total property crimes. Of the total number of property crimes, 28,076 were burglaries, 51,508 were larceny/thefts, and 4,322 were motor vehicle thefts.

Law Enforcement. Mississippi had the 11th most law enforcement employees per population. Mississippi ranked 22nd in the nation for the most police officers per population.

For more Mississippi crime information, please see the Mississippi State Department of Health Criminal History Record Checks Fingerprint Transmission System (FTS) website.

Mississippi Employment Background Check Products

InstantCriminalChecks.com offers two Mississippi employment background check products: a Mississippi county criminal background check and a Mississippi state criminal background check.

The Mississippi state criminal background check includes a Mississippi corrections background check, a sex offender record search of Mississippi as well as the entire country, and a search of the Most Wanted List. The corrections background check pulls historical and current felony conviction records only. The Mississippi state criminal background check is “instant” and results are received within seconds of placing an order. The price of this product is only $24.95. For the full description, please visit our Mississippi criminal background check webpage.

The Mississippi county criminal background check will return felony and misdemeanor convictions and deferred judgments from the justice courts and circuit courts over the past seven years. The results are provided within one to three business days. The cost of this product is $24.95.

Other Mississippi employment background check products include an instant national criminal background check that searches 46 states and D.C. (this product is $59.95) and a 3-state criminal background check (this product is $39.90).

*Sources: U.S. Census Bureau and FBI. “About Mississippi” data is from 2011. “Mississippi Crime Data” data is from 2012.

Share this:

  • Tweet
  • Share on Tumblr
  • Print
  • Email

Filed Under: states

MN Criminal Data and Minnesota Employment Background Check Information

June 12, 2014 by criminalchecks Leave a Comment

Minnesota Employment Background CheckDid you know that Minnesota is the northernmost continental state? This week we are discussing Minnesota crime data, Minnesota employment background check information, state employment/unemployment rate and health insurance coverage.in our weekly blog series, “Criminal Data and Employment Background Check Information for Your Favorite State”!

About Minnesota*

Minnesota Population and Age Distribution. Minnesota’s estimated population was 5.4 million. The median age was 37.6 years. 24% of the population was under the age of 18, and 14% was 65 years and over.

Median Household Income. The median income of households was $58,906. The total number of households was 2,111,943 with an average of 2.48 people.

Minnesota Employment and Unemployment Rate. 65.7% of the Minnesota population over the age of 15 were employed which ranks 3rd in the nation. The Minnesota unemployment rate is 6.3% which was ranked 46th in the country.

Types of Employers. The types of employers in Minnesota were as follows: 163,061 (5.9%) were self-employed, 336,098 (12.1%) were employed by the federal, state, or local government and 2,283,922 (82%) were employed by the private sector.

Top Five Industries. The top five industries by percent in Minnesota were: Educational Services and Health Care (24.7%), Manufacturing (13.6%), Retail (11.4%), Professional/Administrative/Scientific (9.7%), and Accommodations/Food Service/Entertainment (8.1%).

Occupations. Occupations for the population employed (over the age of 15) in Minnesota’s private sector were: Business, Science, and Arts (39.1%), Sales and Office (23.6%), Service (16.3%), Production, Transportation, and Material Moving (13%), and Natural Resources, Construction, and Maintenance (8%).

Minnesota Health Insurance Coverage. 92% of the civilian non-institutionalized population had health insurance coverage (8% had no coverage). Of those with coverage, 76% had private coverage and 28% had public coverage.

Disability. 10% of the civilian non-institutionalized population of Minnesota reported a disability. The Minnesota disability claim rate was ranked 48th in the country.

For a list of Minnesota counties, cities, towns, and county court houses, click here.

Minnesota Crime Data*

Total Violent Crimes. Minnesota had 12,419 total violent crimes (which ranked 28th in the nation) and with a violent crime rate of 0.23% (which ranked it 44th among all the states including DC & PR). Of the total number of violent crimes, 99 were murders, 1,638 were forcible rapes, 3,475 were robberies, and 7,207 were aggravated assaults.

Property Crime. Minnesota had 138,152 total property crimes. Of the total number of property crimes, 25,378 were burglaries, 104,316 were larceny/thefts, and 8,458 were motor vehicle thefts.

Law Enforcement. Minnesota had the 45th most law enforcement employees per population. Minnesota ranked 49th in the nation for the most police officers per population.

For more Minnesota crime information, please see the Minnesota Bureau of Criminal Apprehension (BCA) website.

Minnesota Employment Background Check Products

InstantCriminalChecks.com offers two Minnesota employment background check products: a Minnesota county criminal background check and a Minnesota state criminal background check.

The Minnesota state criminal background check includes a Minnesota courts background check, Minnesota corrections background check, a sex offender record search of Minnesota as well as the entire country, and a search of the Most Wanted List. The corrections background check pulls felony and misdemeanor data. The Minnesota courts background check pulls current and historical felony and gross misdemeanor checks. The Minnesota state criminal background check is “instant” and results are received within seconds of placing an order. The price of this product is only $24.95. For the full description, please visit our Minnesota criminal background check webpage.

The Minnesota county criminal background check will return felony and misdemeanor convictions and deferred judgments from the county district courts and the judicial district courts over the past seven years. The results are provided within one to three business days. The cost of this product is $24.95.

Other Minnesota employment background check products include an instant national criminal background check that searches 46 states and D.C. (this product is $59.95) and a 3-state criminal background check (this product is $39.90).

*Sources: U.S. Census Bureau and FBI. “About Minnesota” data is from 2011. “Minnesota Crime Data” data is from 2012.

Share this:

  • Tweet
  • Share on Tumblr
  • Print
  • Email

Filed Under: states

HRemploymentScreening.com offers Advanced Employment Screening Solutions

June 9, 2014 by criminalchecks Leave a Comment

Advanced Employment ScreeningAt InstantCriminalChecks.com, we have long prided ourselves on the fact that we provide the best, most immediate and advanced criminal background check services for our clients. With this unparalleled level of service in mind, we are excited to announce a new partnership with the website HRemploymentScreening.com. HRemploymentScreening.com provides its clients with an affordable set of advanced employment screening services, designed to paint a comprehensive picture of a potential job candidate.

For years, local business owners and small corporations have relied on our background check services and on our expertise at InstantCriminalChecks.com. With our new partnership, we are able to invite large corporation and major companies to experience our unique level of service. HRemploymentScreening.com provides customers with many different types of advanced employment screening services, including national criminal background checks, employment verification services, professional reference verification services and educational verification services. Customers also can obtain driving records, social security number traces, credit reports, drug testing and national sex offender registry information when working with HRemploymentScreening.com.

We know that our customers love the criminal background check services they receive when they work with InstantCriminalChecks.com. We are known for truly listening to customer feedback and implementing those changes within our organization in order to improve the experience for all of our customers. InstantCriminalChecks.com customers will be excited to know that those same customer service techniques are in place at HRemploymentScreening.com. As the company begins to grow and develop, the professionals at HRemploymentScreening.com look forward to offering advanced employment screening services and hearing feedback from all of its clients. Clients can expect to see the company change and grow in the ways that they desire, as well as expand their employment screening solutions in order to help them make better hiring decisions for their respective organizations. We look forward to the opportunity of helping our new partner grow.

Share this:

  • Tweet
  • Share on Tumblr
  • Print
  • Email

Filed Under: blog

Michigan Employment Background Check Information and Michigan (MI) Criminal Data

June 5, 2014 by criminalchecks Leave a Comment

Michigan Employment Background CheckDid you know that Michigan is the only state to consist of two peninsulas? This week we are discussing Michigan employment background check information, Michigan crime data, and other general state information in our weekly blog series, “Criminal Data and Employment Background Check Information for Your Favorite State”!

About Michigan*

Michigan Population and Age Distribution. Michigan’s estimated population was 9.9 million. The median age was 39.5 years. 23% of the population was under the age of 18, and 15% was 65 years and over.

Median Household Income. The median income of households was $46,859. The total number of households was 3,819,068 with an average of 2.53 people.

Michigan Employment and Unemployment Rate. 54.3% of the Michigan population over the age of 15 were employed which ranks 42nd in the nation. The Michigan unemployment rate is 11.3% which was ranked 4th in the country.

Types of Employers. The types of employers in Michigan were as follows: 220,527 (5.1%) were self-employed, 491,973 (11.5%) were employed by the federal, state, or local government and 3,565,477 (83.2%) were employed by the private sector.

Top Five Industries. The top five industries by percent in Michigan were: Educational Services and Health Care (24%), Manufacturing (17.2%), Retail (11.4%), Accommodations/Food Service/Entertainment (9.6%), and Professional/Administrative/Scientific (9.4%).

Occupations. Occupations for the population employed (over the age of 15) in Michigan’s private sector were: Business, Science, and Arts (34.1%), Sales and Office (24.2%), Service (19%), Production, Transportation, and Material Moving (15%), and Natural Resources, Construction, and Maintenance (7.7%).

Michigan Health Insurance Coverage. 89% of the civilian non-institutionalized population had health insurance coverage (11% had no coverage). Of those with coverage, 69% had private coverage and 34% had public coverage.

Disability. 14% of the civilian non-institutionalized population of Michigan reported a disability. The Michigan disability claim rate was ranked 13th in the country.

For a list of Michigan counties, cities, towns, and county court houses, click here.

Michigan Crime Data*

Total Violent Crimes. Michigan had 44,922 total violent crimes (which ranked 6th in the nation) and with a violent crime rate of 0.45% (which ranked it 13th among all the states including DC & PR). Of the total number of violent crimes, 689 were murders, 4,589 were forcible rapes, 10,434 were robberies, and 29,210 were aggravated assaults.

Property Crime. Michigan had 250,101 total property crimes. Of the total number of property crimes, 65,665 were burglaries, 159,321 were larceny/thefts, and 25,115 were motor vehicle thefts.

Law Enforcement. Michigan had the 49th most law enforcement employees per population. Michigan ranked 45th in the nation for the most police officers per population.

For more Michigan crime information, please see the Michigan Criminal Justice Information Center (CJIC) website.

Michigan Employment Background Check Products

InstantCriminalChecks.com offers two Michigan employment background check products: a Michigan county criminal background check and a Michigan state criminal background check.

The Michigan state criminal background check includes a Michigan corrections background check, a sex offender record search of Michigan as well as the entire country, and a search of the Most Wanted List. The corrections background check pulls from records on inmates, parolees, and individuals who were under the supervision of the Michigan DOC. The Michigan state criminal background check is “instant” and results are received within seconds of placing an order. The price of this product is only $24.95. For the full description, please visit our Michigan criminal background check webpage.

The Michigan county criminal background check will return felony and misdemeanor convictions and deferred judgments from the district courts and circuit courts over the past seven years. The results are provided within one to three business days. The cost of this product is $24.95.

Other Michigan employment background check products include an instant national criminal background check that searches 46 states and D.C. (this product is $59.95) and a 3-state criminal background check (this product is $39.90).

*Sources: U.S. Census Bureau and FBI. “About Michigan” data is from 2011. “Michigan Crime Data” data is from 2012.

Share this:

  • Tweet
  • Share on Tumblr
  • Print
  • Email

Filed Under: states

New InstantCriminalChecks.com Criminal Data Resource Pages Announced

May 28, 2014 by criminalchecks Leave a Comment

At InstantCriminalChecks.com, we have found that our customers want more than just a fast, easy and efficient way to get quick criminal history check ordering. While we do provide these services and many people have come to rely on our products, we also want to help extend our outreach efforts and work to educate our customers about the criminal history check industry. With this in mind, we have recently launched two new criminal data resource pages on our website.

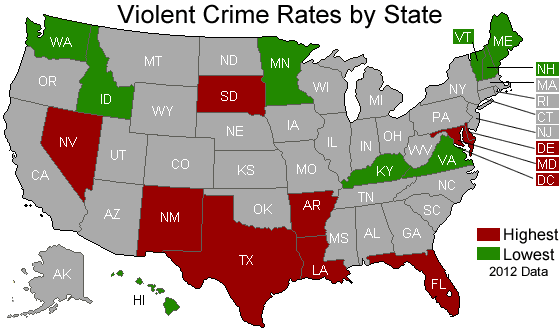
The first new resource page is the Violent Crime Percentage by State page. Within this resource page, our customers will find reliable, accurate information about the violent crimes that take place on a state-by-state basis. This may help our clients narrow down their searches and better understand where to focus their efforts. In addition, it simply helps them stay informed about the violent crimes that are occurring across the country. Many of our customers are employers, parents, neighbors and business owners. They want to know what is going on within their communities, and use this criminal data in order to stay informed and safe.

The second new criminal data resource page is the Types of Violent Crimes page. On this page, clients can learn more about the different types of violent crimes. This helps them to better understand the data that they receive from us, as well as the information that is provided on other resource pages on InstantCriminalChecks.com. There are four types of violent crimes detailed on this resource page: murder, forcible rape, robbery and aggravated assault.

Crime Data

We are excited about these two new resource pages, and we know that our customers will be too. We take pride in the fact that people come to InstantCriminalChecks.com not only for great customer service and accurate, quick criminal history check reports. We love knowing that our customers count on us for information about criminal data, quick criminal history check reports and other background check industry information. We value the trust that our customers place in us as a company, and we are committed to continuing to work to improve our resources for everyone who visits our site.

Share this:

  • Tweet
  • Share on Tumblr
  • Print
  • Email

Filed Under: blog

Massachusetts Employment Background Check Information and MA Criminal Data

May 27, 2014 by criminalchecks Leave a Comment

Massachusetts Employment Background CheckDid you know that the official name of the state of Massachusetts is the “Commonwealth of Massachusetts”? It is sometimes referred to as “the Commonwealth”, but has the same rights as other states in the United States. The three other states in the U.S. that are titled commonwealths are: Kentucky, Pennsylvania, and Virginia. This week we are discussing Massachusetts employment background check information, Massachusetts crime data, and other general state information in our weekly blog series, “Criminal Data and Employment Background Check Information for Your Favorite State”!

About Massachusetts*

Massachusetts Population and Age Distribution. Massachusetts’ estimated population was 6.6 million. The median age was 39.5 years. 21% of the population was under the age of 18, and 15% was 65 years and over.

Median Household Income. The median income of households was $65,339. The total number of households was 2,522,394 with an average of 2.54 people.

Massachusetts Employment and Unemployment Rate. 61.6% of the Massachusetts population over the age of 15 were employed which ranks 15th in the nation. The Massachusetts unemployment rate is 8.5% which was ranked 28th in the country.

Types of Employers. The types of employers in Massachusetts were as follows: 200,499 (6%) were self-employed, 417,770 (12.5%) were employed by the federal, state, or local government and 2,713,058 (81.4%) were employed by the private sector.

Top Five Industries. The top five industries by percent in Massachusetts were: Educational Services and Health Care (27.9%), Professional/Administrative/Scientific (12.8%), Retail (10.9%), Manufacturing (9.1%), Accommodations/Food Service/Entertainment (9%).

Occupations. Occupations for the population employed (over the age of 15) in Massachusetts’ private sector were: Business, Science, and Arts (43.3%), Sales and Office (23.4%), Service (17.4%), Production, Transportation, and Material Moving (8.7%), Natural Resources, Construction, and Maintenance (7.2%).

Massachusetts Health Insurance Coverage. 96% of the civilian non-institutionalized population had health insurance coverage (4% had no coverage). Of those with coverage, 75% had private coverage and 34% had public coverage.

Disability. 12% of the civilian non-institutionalized population of Massachusetts reported a disability. The Massachusetts disability claim rate was ranked 34th in the country.

For a list of Massachusetts counties, cities, towns, and county court houses, click here.

Massachusetts Crime Data*

Total Violent Crimes. Massachusetts had 26,953 total violent crimes (which ranked 15th in the nation) and with a violent crime rate of 0.41% (which ranked it 21st among all the states including DC & PR). Of the total number of violent crimes, 121 were murders, 1,642 were forcible rapes, 6,552 were robberies, and 18,638 were aggravated assaults.

Property Crime. Massachusetts had 143,089 total property crimes. Of the total number of property crimes, 34,540 were burglaries, 99,317 were larceny/thefts, and 9,232 were motor vehicle thefts.

Law Enforcement. Massachusetts had the 30th most law enforcement employees per population. Massachusetts ranked 13th in the nation for the most police officers per population.

For more Massachusetts crime information, please see the Massachusetts Criminal Offender Record Information (CORI) website.

Massachusetts Employment Background Check Products

InstantCriminalChecks.com offers two Massachusetts employment background check products: a Massachusetts county criminal background check and a Massachusetts state sex offender background check.

The Massachusetts county criminal background check will return felony and misdemeanor convictions and deferred judgments from the Superior courts and District courts over the past seven years. The results are provided within one to three business days. The cost of this product is $24.95.

Our Massachusetts employment background check products include a Massachusetts county criminal check, a sex offender record search of Massachusetts as well as the entire country, and a search of the Most Wanted List. For the full description, please visit our Massachusetts criminal background check webpage.

*Sources: U.S. Census Bureau and FBI. “About Massachusetts” data is from 2011. “Massachusetts Crime Data” data is from 2012.

Share this:

  • Tweet
  • Share on Tumblr
  • Print
  • Email

Filed Under: states

Maryland Employment Background Check Information and Maryland MD Criminal Data

May 19, 2014 by criminalchecks Leave a Comment

Maryland Employment Background CheckDid you know that Maryland has the highest median household income which makes it the wealthiest state in the U.S.A.? This week we are discussing Maryland employment background check information, Maryland crime data, and other general state information in our weekly blog series, “Criminal Data and Employment Background Check Information for Your Favorite State”!

About Maryland*

Maryland Population and Age Distribution. Maryland’s estimated population was 5.9 million. The median age was 38.1 years. 23% of the population was under the age of 18, and 13% was 65 years and over.

Median Household Income. The median income of households was $71,122. The total number of households was 2,157,717 with an average of 2.66 people.

Maryland Employment and Unemployment Rate. 62.5% of the Maryland population over the age of 15 were employed which ranks 11th in the nation. The Maryland unemployment rate is 8.3% which was ranked 30th in the country.

Types of Employers. The types of employers in Maryland were as follows: 142,322 (4.8%) were self-employed, 646,019 (22%) were employed by the federal, state, or local government and 2,144,907 (73%) were employed by the private sector.

Top Five Industries. The top five industries by percent in Maryland were: Educational Services and Health Care (23.4%), Professional/Administrative/Scientific (15.5%), Public Administration (10.9%), Retail (10.1%), and Accommodations/Food Service/Entertainment (8.2%).

Occupations. Occupations for the population employed (over the age of 15) in Maryland’s private sector were: Business, Science, and Arts (44.2%), Sales and Office (23.2%), Service (17%), Natural Resources, Construction, and Maintenance (7.8%), and Production, Transportation, and Material Moving (7.8%).

Maryland Health Insurance Coverage. 90% of the civilian non-institutionalized population had health insurance coverage (10% had no coverage). Of those with coverage, 74% had private coverage and 28% had public coverage.

Disability. 10% of the civilian non-institutionalized population of Maryland reported a disability. The Maryland disability claim rate was ranked 46th in the country.

For a list of Maryland counties, cities, towns, and county court houses, click here.

Maryland Crime Data*

Total Violent Crimes. Maryland had 28,055 total violent crimes (which ranked 13th in the nation) and with a violent crime rate of 0.48% (which ranked it 10th among all the states including DC & PR). Of the total number of violent crimes, 369 were murders, 1,235 were forcible rapes, 10,141 were robberies, and 16,310 were aggravated assaults.

Property Crime. Maryland had 162,031 total property crimes. Of the total number of property crimes, 33,732 were burglaries, 113,274 were larceny/thefts, and 15,025 were motor vehicle thefts.

Law Enforcement. Maryland had the 25th most law enforcement employees per population. Maryland ranked 15th in the nation for the most police officers per population.

For more Maryland crime information, please see the Maryland Courts Case Search website.

Maryland Employment Background Check Products

InstantCriminalChecks.com offers two Maryland employment background check products: a Maryland county criminal background check and a Maryland state criminal background check.

The Maryland state criminal background check includes a Maryland corrections background check, a sex offender record search of Maryland as well as the entire country, and a search of the Most Wanted List. The corrections background check pulls records of convicted offenders currently residing in a state correctional institution or under the supervision of the Maryland DOC. The Maryland Administrator of Courts contains felony and misdemeanors from the district courts. The Maryland state criminal background check is “instant” and results are received within seconds of placing an order. The price of this product is only $24.95. For the full description, please visit our Maryland criminal background check webpage.

The Maryland county criminal background check will return felony and misdemeanor convictions and deferred judgments over the past seven years. The results are provided within one to three business days. The cost of this product is $24.95.

Other Maryland employment background check products include an instant national criminal background check that searches 46 states and D.C. (this product is $59.95) and a 3-state criminal background check (this product is $39.90).

*Sources: U.S. Census Bureau and FBI. “About Maryland” data is from 2011. “Maryland Crime Data” data is from 2012.

Share this:

  • Tweet
  • Share on Tumblr
  • Print
  • Email

Filed Under: states

« Previous Page
Next Page »

Background Check Order Options


Instant Background Checks
State Criminal Checks $24.95
National Criminal Check $59.95

Other Background Checks
County Criminal Checks $24.95
Federal Background Check $29.95
SSN Trace - Address History $14.95
Professional Background Screening Association (PBSA)

Recent Blog Posts

  • 4 Revealing Interview Tips to Help You Choose the Right Candidate August 15, 2022
  • The Importance of a Diverse Hiring Panel and 4 Common Hiring Process Mistakes February 28, 2022
  • Guide to Performing Reference Checks When Hiring September 30, 2021
  • Recruiting In a Time of High Unemployment: What You Need to Know February 23, 2021
  • 5 Employment Red Flags That May Show Up on a Background Check October 30, 2020

Blog POSTS

4 Revealing Interview Tips to Help You Choose the Right Candidate

August 15, 2022

The Importance of a Diverse Hiring Panel and 4 Common Hiring Process Mistakes

February 28, 2022

Guide to Performing Reference Checks When Hiring

September 30, 2021

Recruiting In a Time of High Unemployment: What You Need to Know

February 23, 2021

5 Employment Red Flags That May Show Up on a Background Check

October 30, 2020

Required Background Checks for Employees Who Have Access to Federal Tax Information

July 28, 2020

6 Employment Screening Trends Already Shaping 2020

March 26, 2020

3 Reasons to Background Check Student Interns and Employees

December 17, 2019

Dispelling 3 Myths About Employee Background Screening

October 30, 2019

5 Key Employer Tips For Hiring Veterans and Retaining Veterans

August 28, 2019

Steps For Effectively Screening and Hiring Remote Workers

July 26, 2019

Background Check Red Flags: Warning Signs Employers Should Watch For

April 30, 2019

How the Evolution of AI is Streamlining Employment Screening Processes

February 28, 2019

President Trump Endorses Prison Reform Bill

December 31, 2018

6 Employee Recruitment Ideas For New Businesses

November 15, 2018

Why the Most Successful Businesses Use Employment Background Checks

October 31, 2018

Qualities to Look For in An Employment Background Screening Service

September 27, 2018

What Employers Should Know About Rolling Background Checks

August 7, 2018

Background Check Trends for 2018 by InstantCriminalChecks.com

July 24, 2018

The Case For Giving Applicants with a Criminal Past a Second Chance

June 26, 2018

Uber Company Raises Standards For Drivers By Enacting More Stringent Background Checks

June 5, 2018

How the Opioid Crisis in the U.S. is Affecting Employment Screening

May 24, 2018

Resume Red Flags Can Cause Hiring Managers To Overlook You

April 26, 2018

How a Comprehensive Criminal Search Can Cost You the Job

March 29, 2018

Kansas City, Missouri One of the Latest Cities to Adopt Ban the Box Ordinance

February 27, 2018

7 Key Pre-Employee Screening Steps Employers Should Take

January 30, 2018

The Top 5 Essential Elements of Successful Pre-Employment Background Checks

December 29, 2017

Equifax Data Breach Heightens Need for Background Checks

October 26, 2017

New Survey Reveals Half of All Job Applicants Lie on Their Resumes

September 28, 2017

Indiana Bill Ceasing Ban-The-Box Laws Could Impact National Employment Policies

August 29, 2017

Background Check Limitations: How Far Back Do Criminal Background Checks Go?

July 6, 2017

Innovative Hiring Process Ideas from Today’s Top Companies

June 6, 2017

When Criminal Background Checks Protect Employers And Employees

May 11, 2017

Criminal Background Checks and Marijuana Legalization

April 25, 2017

Why it is a Mistake to Rely on the FBI Fingerprint Database

March 8, 2017

Is Your Company At Risk For Hiring A Cyber Criminal?

February 22, 2017

The High Cost of Foregoing Workplace Background Checks

February 9, 2017

Background Check Frequently Asked Questions FAQs

January 18, 2017

Big Wins for Small Business Background Checks

January 9, 2017

How Does America Rank on Teacher Background Checks?

September 19, 2016

FBI Reports Violent Crime Rate Increase Hits Mid-Sized Cities Hardest

August 22, 2016

What Interview Questions Employers Should Not Ask

August 8, 2016

Loss Prevention: Background Check Effectiveness

July 5, 2016

The Three Biggest Employee Screening Trends in 2016

June 6, 2016

3 reasons why you need to do employee criminal history checks on your employees

May 5, 2016

How Did a Registered Sex Offender Become a Mall Easter Bunny?

April 12, 2016

The Ins And Outs Of Emp Screening In The Modern Regulatory Environment

March 28, 2016

Recent Incidents Draw Regulatory Attention To Security Guard Background Checks

March 7, 2016

Top 5 Pre-Employment Background Screening Best Practices

February 16, 2016

How to Hire Like Google: Employer Trends in Worker Evaluation and Job Placement

February 8, 2016

Avoiding Violence In The Workplace With Employment Background Checks

January 26, 2016

5 Reasons Startups Should Have a Hiring Plan

January 6, 2016

U.S. Employment Trends To Watch In 2016

December 28, 2015

How Are “Ban The Box” Laws Affecting Criminal Background Checks?

December 10, 2015

5 Tips for Small Business Employee Background Checks

December 3, 2015

4 Reasons To Screen Contingent Workers Such As Consultants And Freelancers

November 11, 2015

Are Credit Checks On The Way Out As An Employment Background Check Tool?

October 27, 2015

Minimizing the Risks of Criminal Background Screenings

October 22, 2015

How to Minimize the Risks of Using Social Media Screening when Hiring Job Applicants

October 5, 2015

EEOC: What Employers Need to Know About Background Checks

September 30, 2015

How Employers Can Prevent Falling Victim to Resume Fraud

September 21, 2015

How Employers Can Avoid Negligent Hiring Claims

September 8, 2015

6 Reasons to Background-Check Every Potential New Hire

August 25, 2015

Running an Employment History Check is Complicated

August 18, 2015

4 Key Pre-Employee Screening Tips for Small Business Owners

August 11, 2015

6 Best Practices for Completing an Employment Check

August 4, 2015

Pre-Employment Background Checks May Expose a History of Violence

July 28, 2015

5 Stark Realities of Freelancing Jobs

July 21, 2015

Providing Leadership for Working Millennials

July 14, 2015

How Human Resources Professionals Use HR Tech

July 7, 2015

Identifying Violent Offenders: Not All Felons are the Same

May 31, 2015

Criminal Background Checks Could Curtail Employee Theft in the Workplace

April 30, 2015

Negligent Hiring Lawsuits – Negligent Hiring and Retention Laws

March 31, 2015

Wyoming Employment Background Check Information and Wyoming (WY) Criminal Data

December 29, 2014

Wisconsin Employment Background Check Information and Wisconsin (WI) Criminal Data

December 22, 2014

West Virginia Employment Background Check Information and WV Criminal Data

December 8, 2014

Washington Employment Background Check Information and WA Criminal Data

December 1, 2014

Virginia Employment Background Check Information and Virginia (VA) Criminal Data

November 24, 2014

Vermont Employment Background Check Information and Vermont (VT) Criminal Data

November 17, 2014

Utah Employment Background Check Information and Utah (UT) Criminal Data

November 11, 2014

Texas Employment Background Check Information and Texas (TX) Criminal Data

November 7, 2014

Tennessee Employment Background Check Information and TN Criminal Data

October 31, 2014

South Dakota Employment Background Check Information and SD Criminal Data

October 23, 2014

School District Implements Volunteer Background Checks Policy

October 20, 2014

South Carolina Employment Background Check Information and SC Criminal Data

October 16, 2014

Rhode Island Employment Background Check Information and RI Criminal Data

October 9, 2014

Puerto Rico Employment Background Check Information and PR Criminal Data

October 2, 2014

Pennsylvania Employment Background Check Information and PA Criminal Data

September 25, 2014

Oregon Employment Background Check Information and Oregon (OR) Criminal Data

September 17, 2014

Oklahoma Employment Background Check Information and Oklahoma Criminal Data

September 12, 2014

Ohio Employment Background Check Information and Ohio (OH) Criminal Data

September 4, 2014

Taxpayers Exposed To Risk Due To Lack Of IRS Background Checks

September 2, 2014

North Dakota Employment Background Check Information and ND Criminal Data

August 27, 2014

North Carolina Employment Background Check Information and NC Criminal Data

August 19, 2014

New York Employment Background Check Information and NY Criminal Data

August 12, 2014

New Mexico Employment Background Check Information and NM Criminal Data

August 6, 2014

New Jersey Employment Background Check Information and NJ Criminal Data

July 31, 2014

New Hampshire Employment Background Check Information and NH Criminal Data

July 24, 2014

Nevada Employment Background Check Information and Nevada (NV) Criminal Data

July 16, 2014

Recent Blog Posts

  • 4 Revealing Interview Tips to Help You Choose the Right Candidate
  • The Importance of a Diverse Hiring Panel and 4 Common Hiring Process Mistakes
  • Guide to Performing Reference Checks When Hiring
  • Recruiting In a Time of High Unemployment: What You Need to Know

Tweets by iCriminalChecks

Follow InstantCriminalChecks.com

  • Email
  • Flickr
  • LinkedIn
  • Pinterest
  • RSS
  • Tumblr
  • Twitter
  • YouTube
Follow Instant Criminal Checks
Search Instant Criminal Checks
Instant Criminal Checks Site Map

© Copyright 2003-Present www.InstantCriminalChecks.com by Screening Intelligence LLC " All Rights Reserved | Security | Privacy | Terms of Use |
The information on InstantCriminalChecks.com is governed by our Terms of Use and is never intended as legal advice.